Data and Signals
in Customer Retention

Most account managers still rely on calendar schedules, standard playbooks, and reactive support to manage existing customers. This guide shows you how data and behavioral signals help you understand customer health, predict risks, and maximize customer lifetime value — before problems arise.
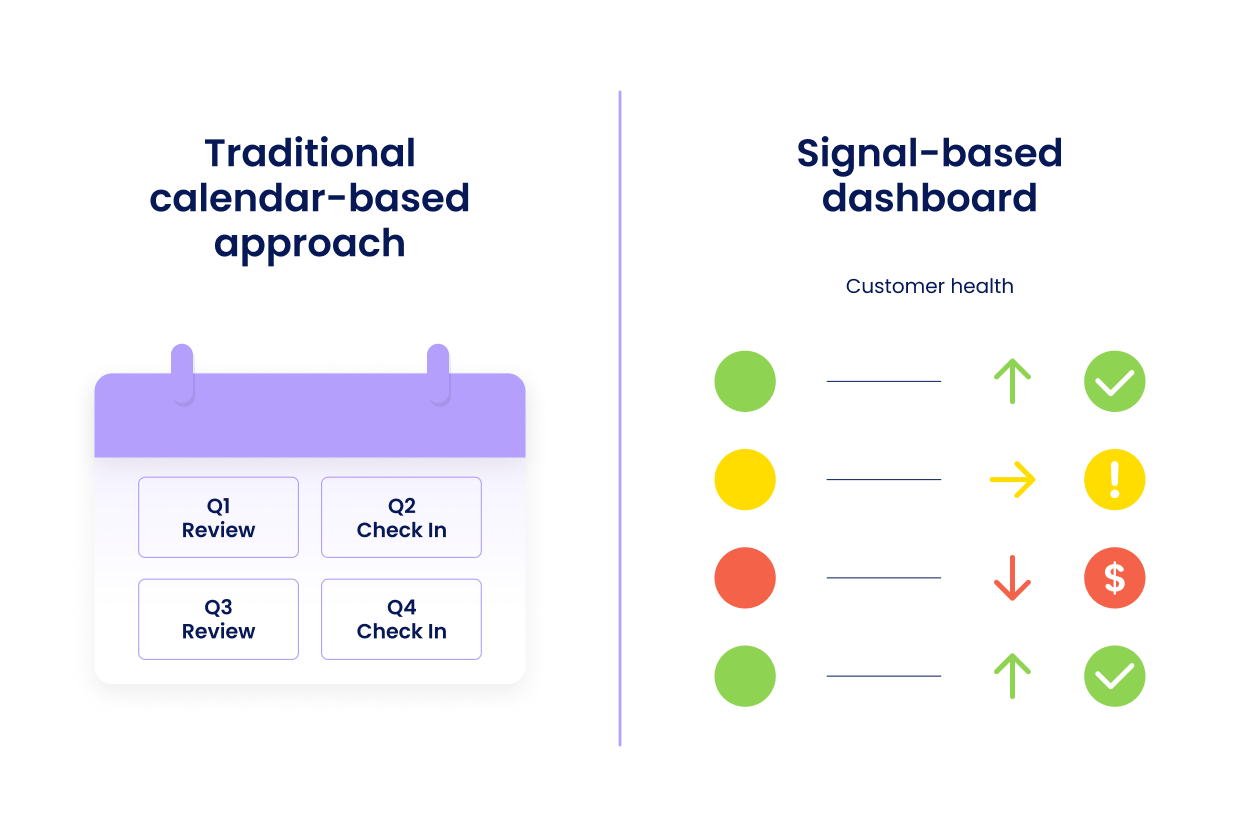
Table of Contents
- Benefit of using Data and Signals in Customer Management
- Customer Data and Signals: The Four Categories that matter most
- Putting your Information to Work: A Step-by-Step Guide for Building Your Signal Detection System
- Quick Recap
Benefit of using Data and Signals in Customer Management
You're preparing quarterly renewals when the CEO asks: "How confident are we that customer XY will renew?" You check your spreadsheet — the account shows green because they've been with you three years.
Two weeks later, this account calls: "We're exploring alternatives." You're blindsided. They hadn't logged in for two months, submitted four support tickets, and their champion left. All while marked "green."
You missed the warning signs — managing by spreadsheet instead of reality.
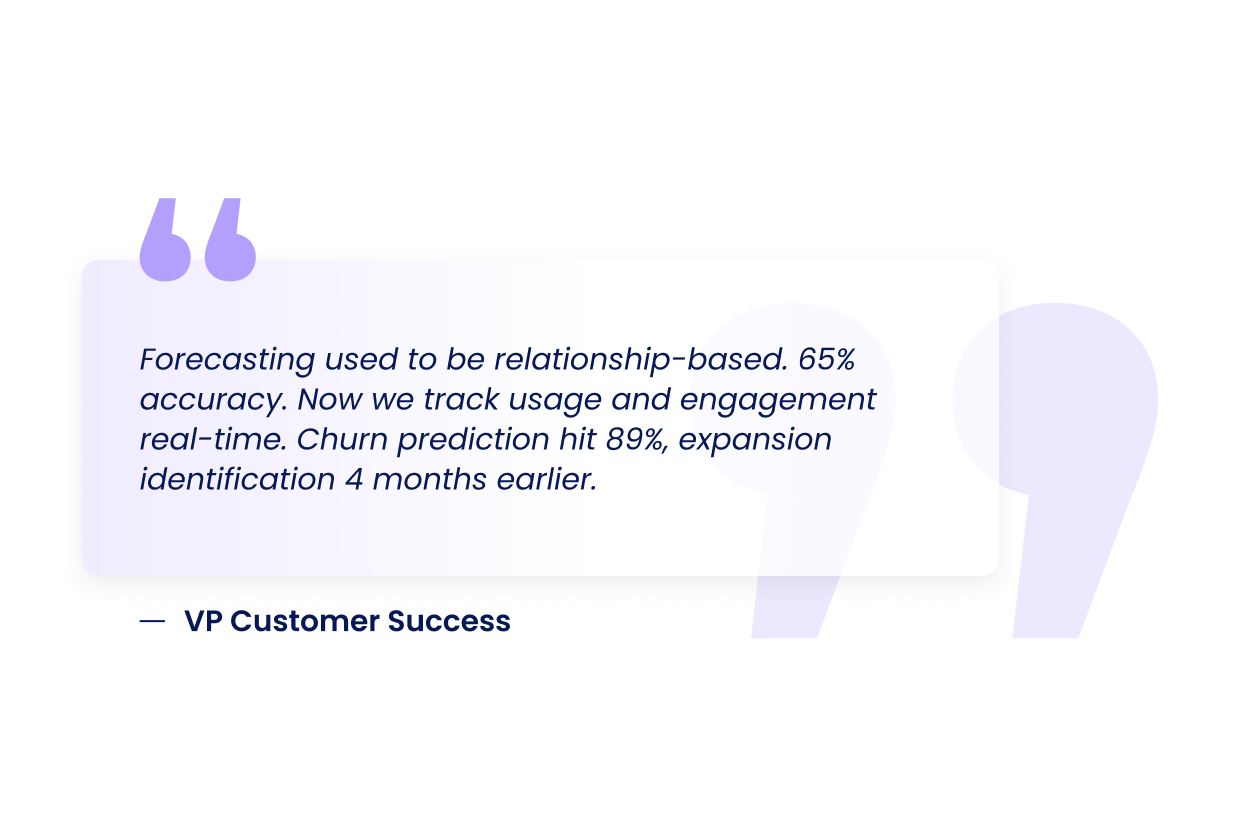
That's why successful teams use behavioral signals to predict risks before they escalate and identify expansion opportunities during success moments.
They act based on actual customer behavior: usage patterns, support interactions, engagement levels — not contract dates or gut feelings.
They are aware of change before it happens: declining usage, support spikes, feature adoption surges — not quarterly calendar reminders.
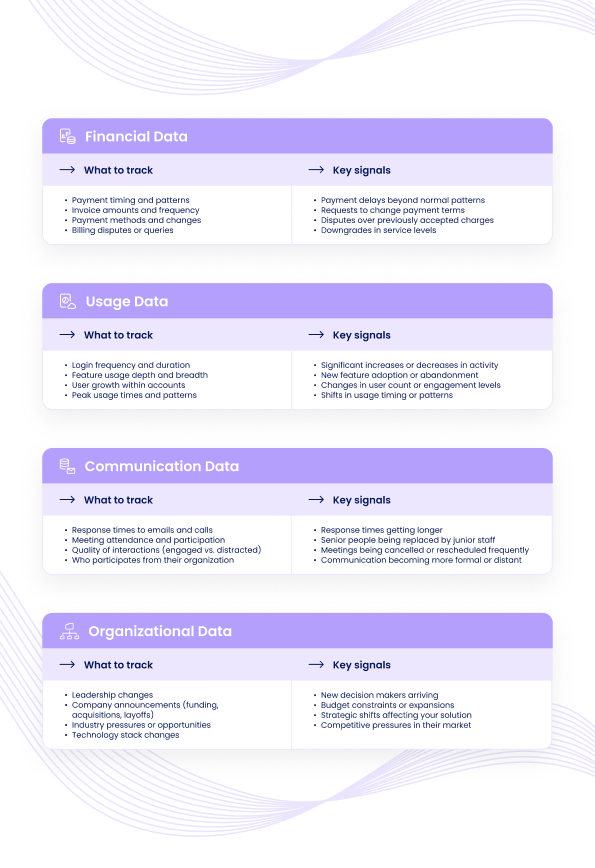
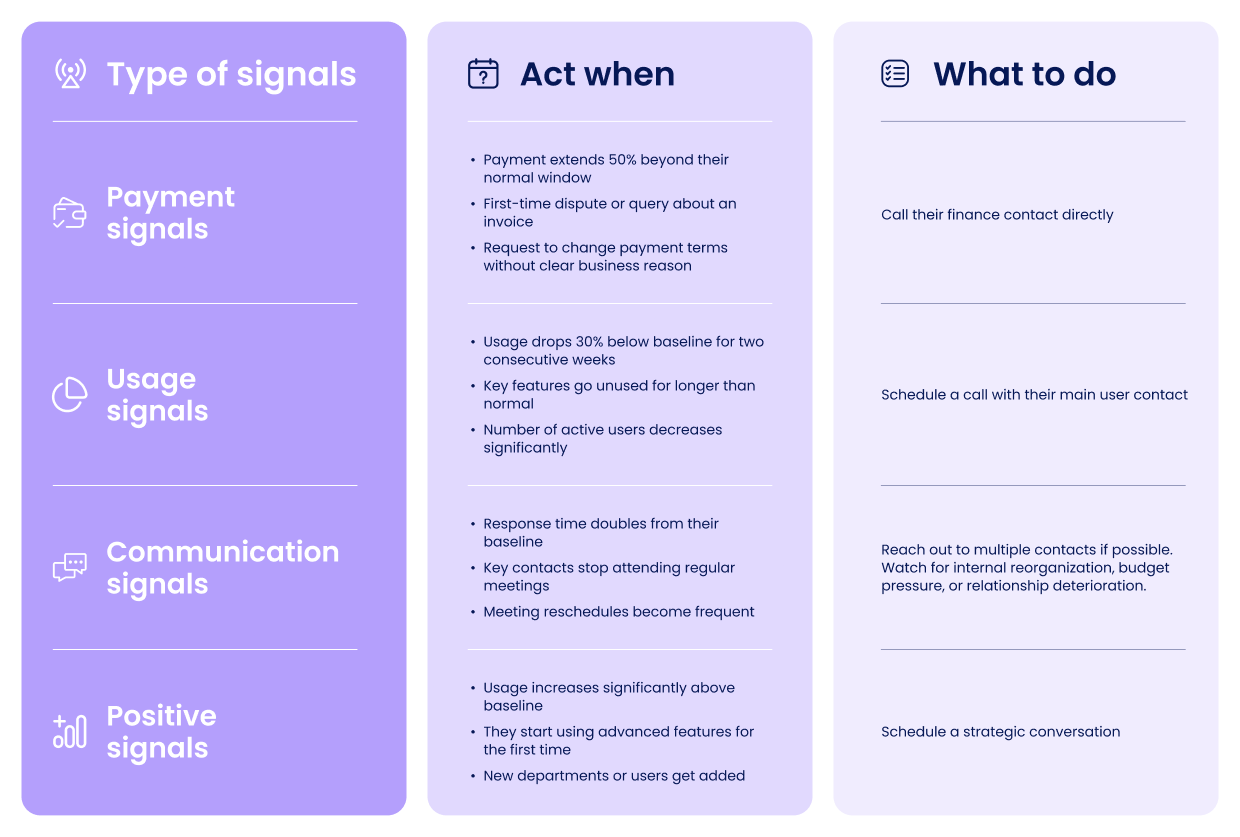
Customer Data and Signals: The Four Categories that matter most
Instead of following standardized schedules, successful customer management combines customer data with relevant customer signals to understand their current situation and trajectory.
Focus on these four categories:
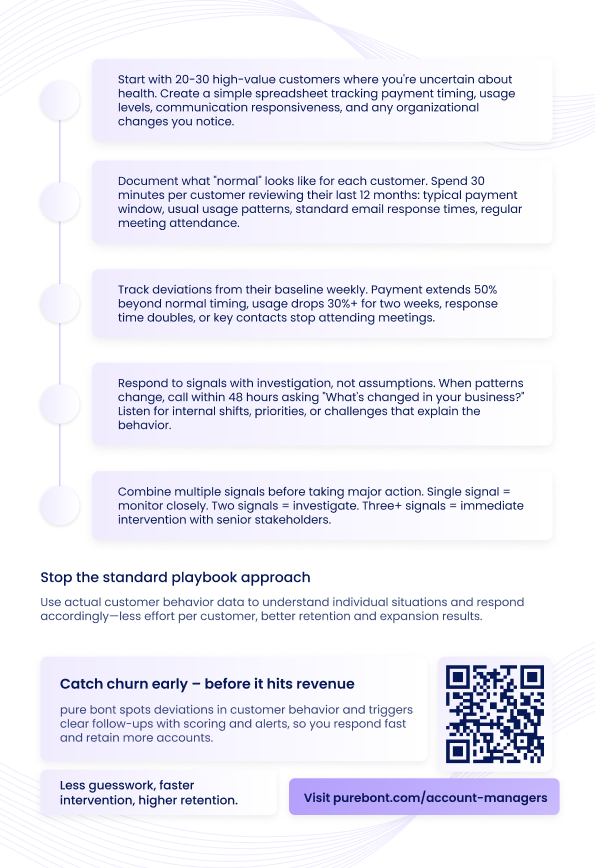
Putting your Information to Work: A Step-by-Step Guide for Building Your Signal Detection System
Step 1: Choose Your Starting Customers
How to pick the right 20–30 accounts:
Open your customer list and filter by annual contract value. Look for customers in your top revenue tiers where you answer "maybe" or "I'm not sure" to these questions:
- Are they definitely renewing next year?
- Would they recommend us to others?
- Are they using our product to its full potential?
- Do we have a strong relationship with key stakeholders?
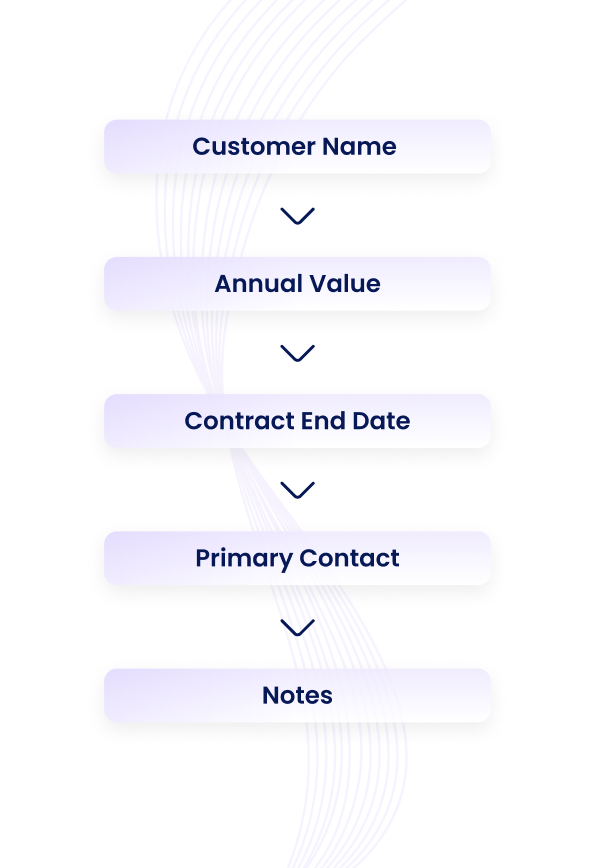
→ Create your tracking list:
Set up a simple spreadsheet with columns for Customer Name, Annual Value, Contract End Date, Primary Contact, and Notes. This becomes your signal dashboard.
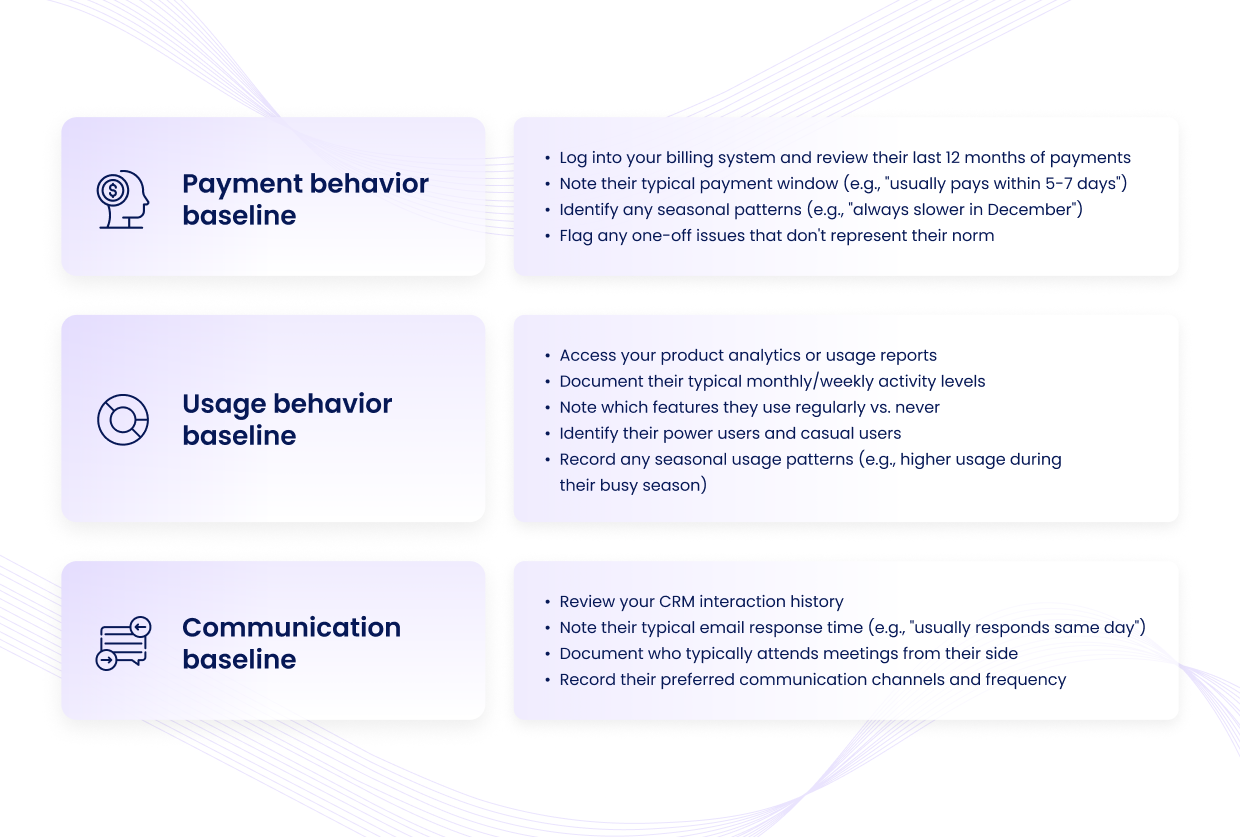
Step 2: Document What "Normal" Looks Like
For each customer, spend 30 minutes researching their baseline patterns.
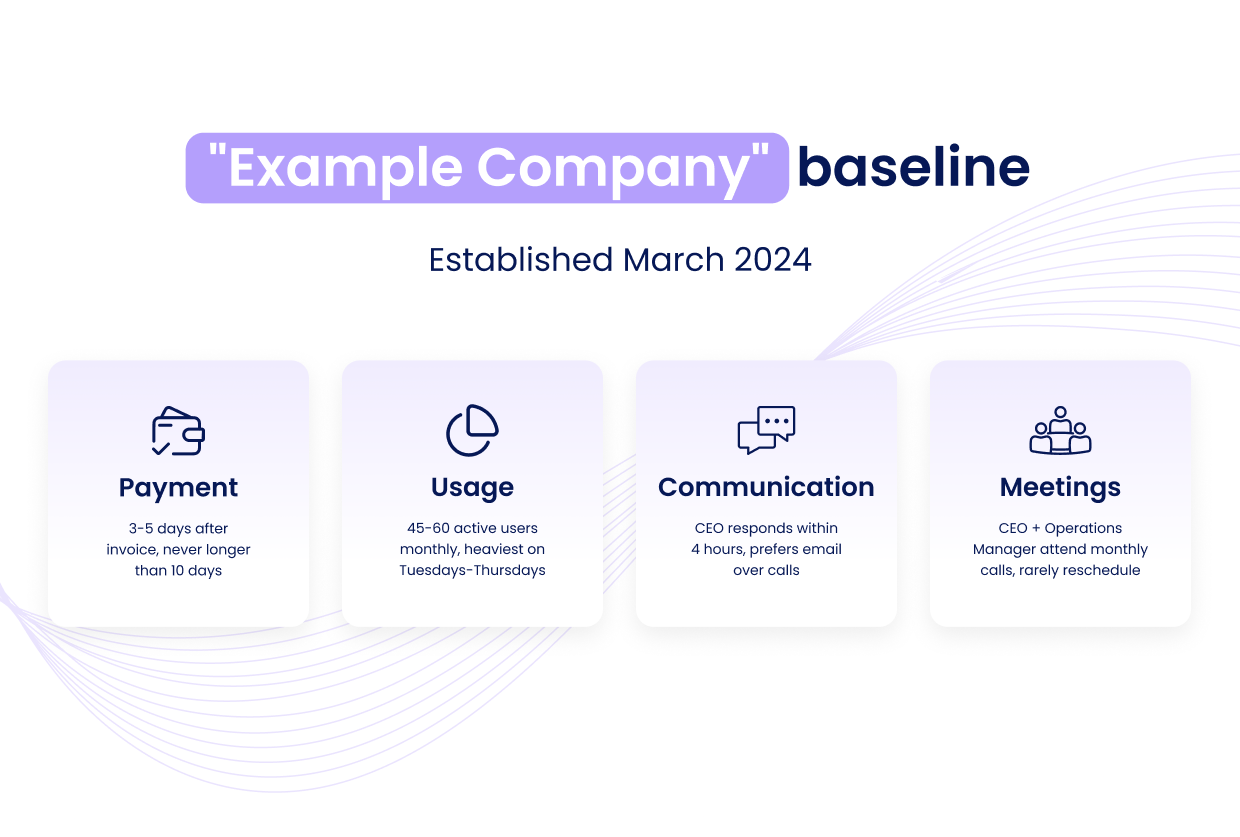
Example baseline profile:
Step 3: Set Up Your Tracking System
Use what you already have:
If you have a modern CRM (Salesforce, HubSpot, etc.):
- Set up custom fields for "Payment Status," "Usage Trend," and "Communication Health"
- Create automated alerts for invoice aging beyond normal terms
- Use reporting features to track usage data if integrated
If you have basic tools:
- Create a Google Sheet with tabs for each customer
- Set up weekly calendar reminders to update the data
- Use conditional formatting to highlight concerning changes (red for declining, green for improving)
Essential tracking points to update weekly:
- Last payment date and any delays beyond their norm
- Current usage levels compared to their baseline
- Communication responsiveness (response times, meeting attendance)
- Any organizational changes you learn about
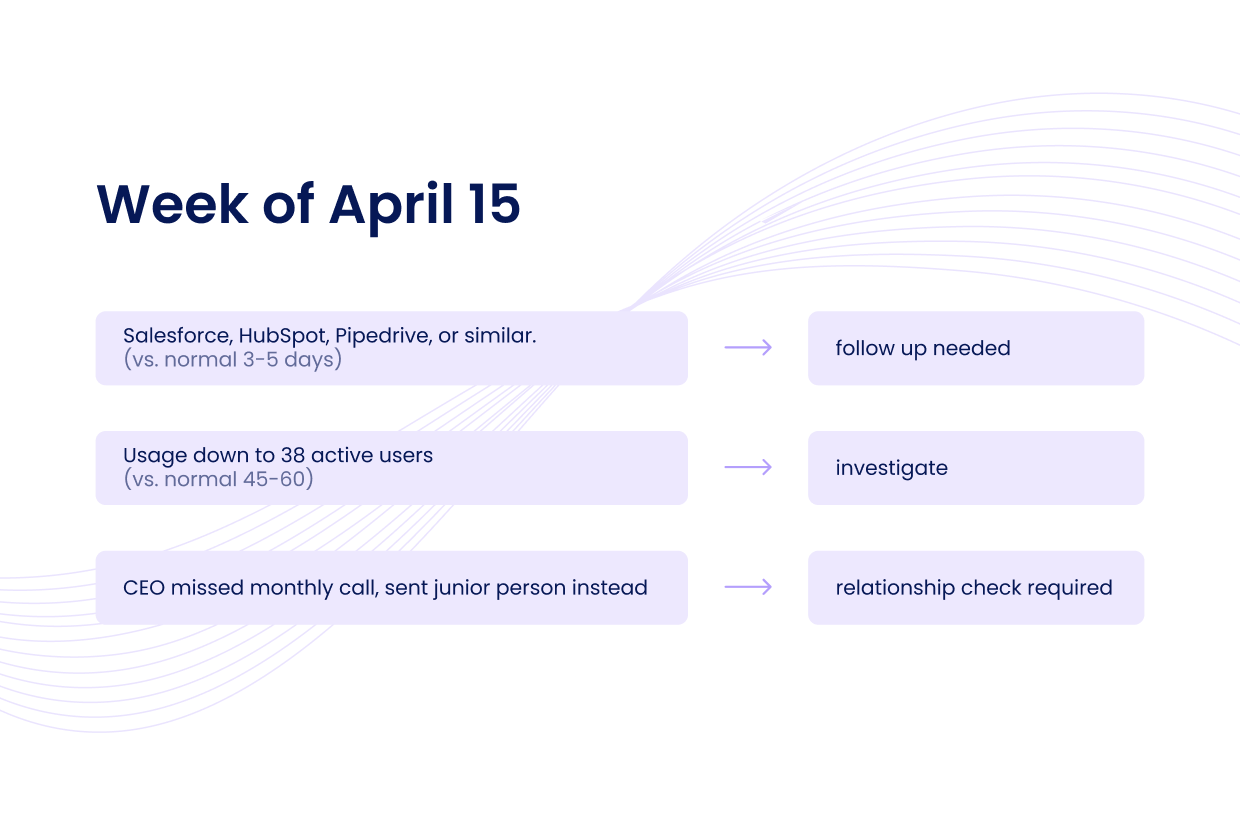
Example tracking entry:
Step 4: Respond to Pattern Deviations
Create action triggers with specific thresholds:
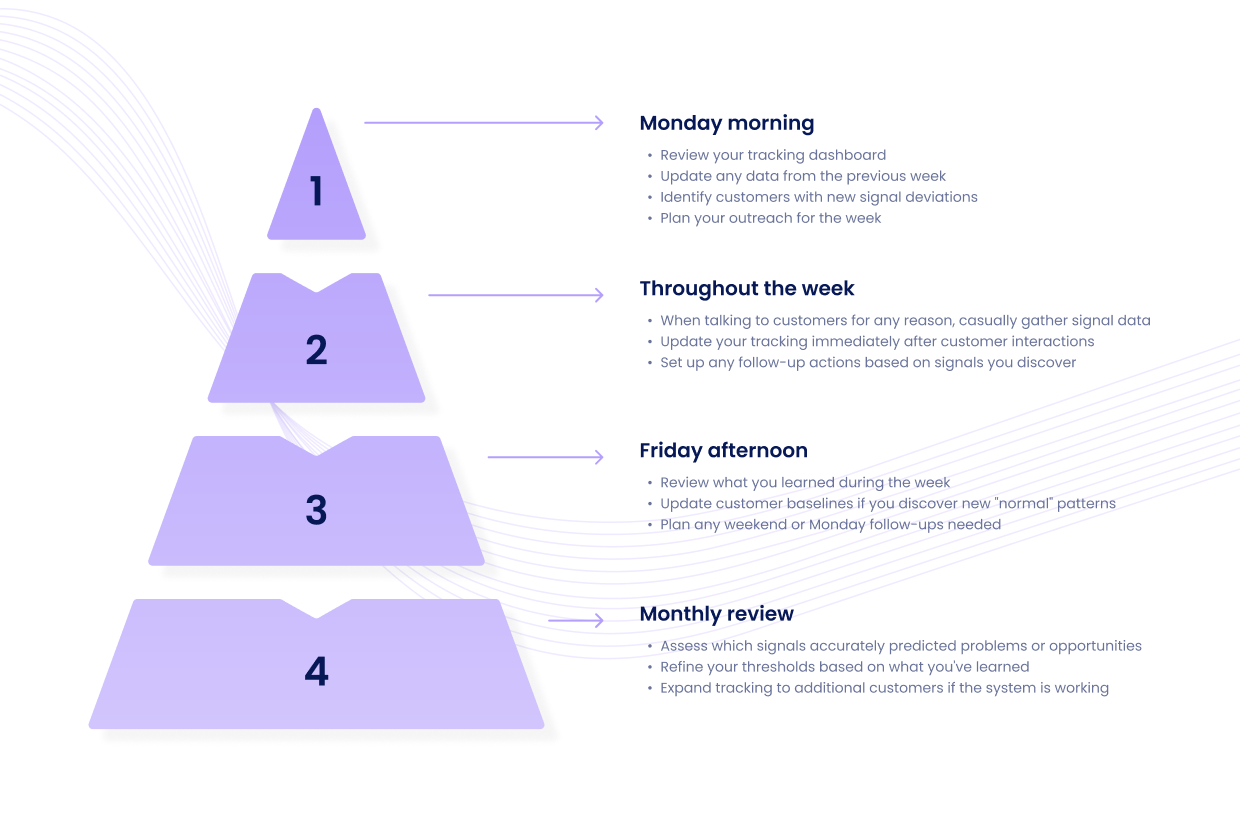
Step 5: Build Your New Routine
Quick Recap